Please note that artificial influences are only visible to regulator users (due to data rights).
Reviewing Artificial Influences
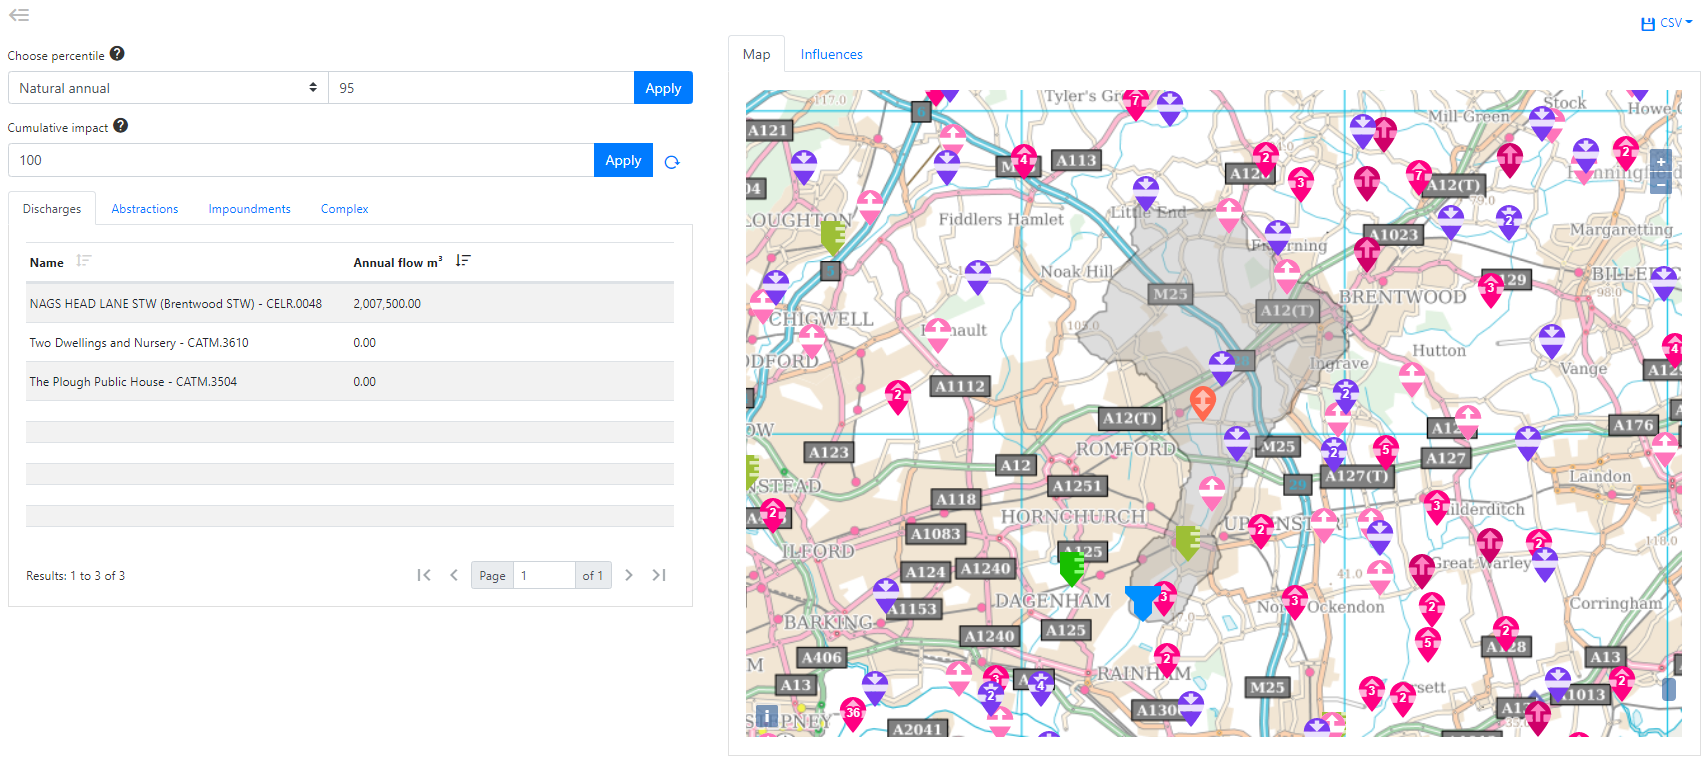
Should influences be present in your catchment, click on the Flow Estimation Results influence buttons or the stack chart to access the Artificial Influences Catchment Report.
The artificial influences are separated by type of influence are displayed in a sortable table and either map or chart.
Tip: Selecting a particular influence site in the table or chart will highlight the site in the table, map and chart.
Map
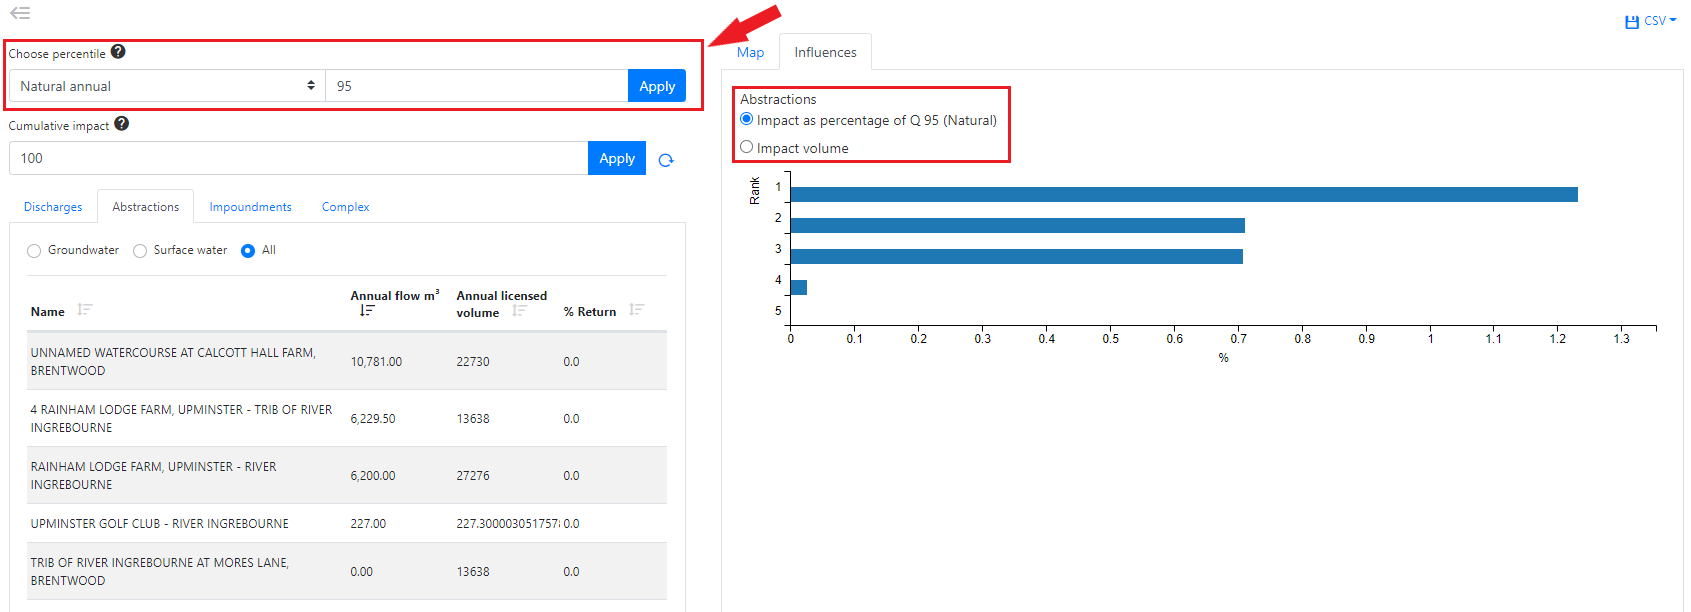
Influences Chart
The chart ranks the influence by size and presents either:
-
the percentage influence at a given natural or influenced percentile for the selected annual or month; or
-
the impact volume.
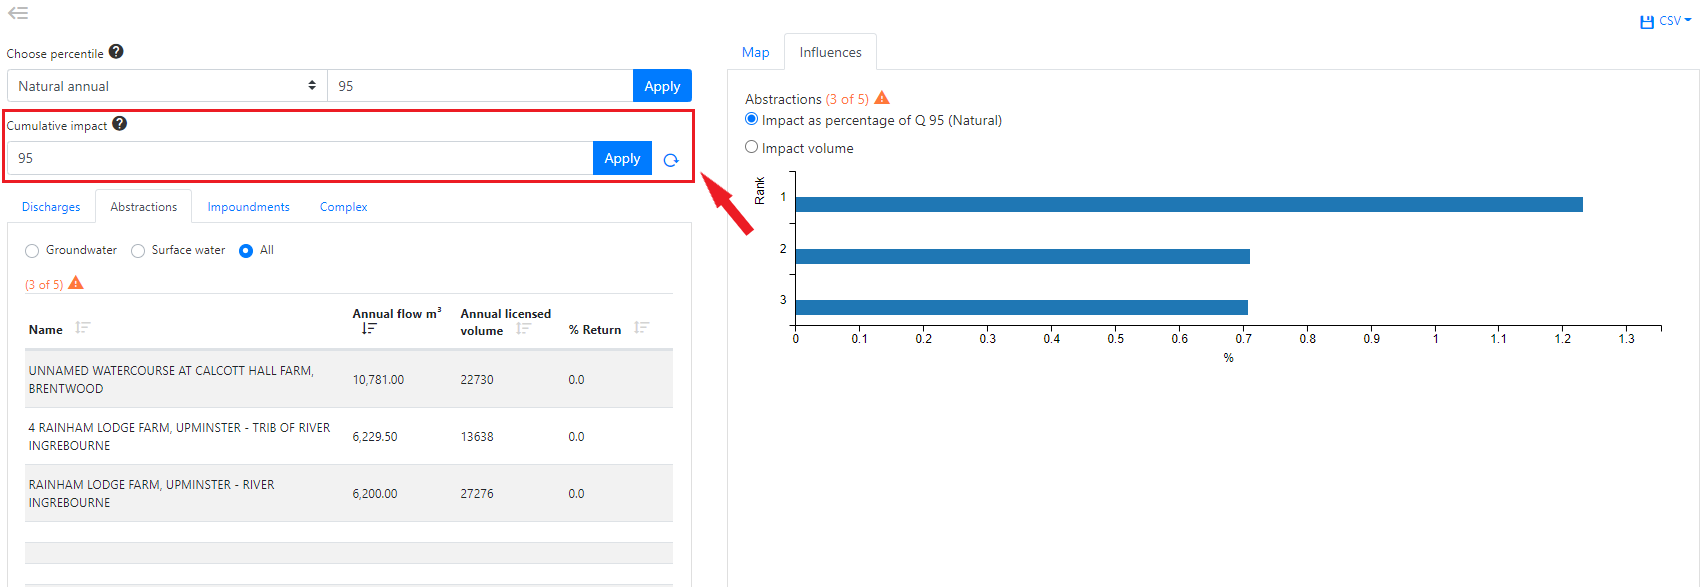
Filtering Artificial Influences
All influence types can be filtered to present the largest influences that contribute to a given cumulative percentage impact. Warning triangles are displayed to highlight the filtered number of sites displayed in the table and chart. The total number of sites for each feature type is also shown for context.
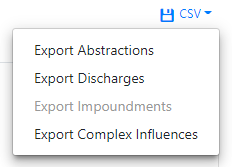
Exporting Artificial Influences
All influence features within the catchment can be exported by type to csv.
Tip: If you need to export an area larger than a catchment (e.g. a hydrometric area) you can upload the boundary as a user-defined catchment.