Introduction
This method statement defines the methods by which the impact of artificial influences (the influence of water use and return) on rivers is modelled within Qube.
In natural rivers, the magnitude of low river flow is determined by climatic and runoff generation processes, amongst which effective rainfall, groundwater recharge and aquifer properties exert a dominant function. However, as a result of the development of rivers and catchments for a variety of purposes, including water supply and transport and dilution of effluent, few rivers now possess natural river flow regimes.
The impact of man's development of water is most severe during periods of low flows when absolute volumes of water transfers represent a significantly higher proportion of the natural flow regime. As a consequence, the estimation of the influence of water use on a natural flow regime within Qube is made on the basis of the influence on average monthly flow statistics. The use of natural low flow statistics and artificial influence data estimated on a monthly basis allows the seasonal variations in flows and operation of individual artificial influences to be taken into account. In particular, the lower summer flows are more sensitive to variations in the scale of the artificial influence.
Net Monthly Influence Profiles
It is necessary to define the cumulative impact of all upstream artificial influences before adjusting the natural low flow statistics at an ungauged location. The nett impact of these artificial influences in each month can be represented by a monthly influence profile that allows the seasonal variations in certain operating regimes to be taken into account. The key steps to the construction of a monthly influence profile at a location are summarised as follows:
- Identification of all artificial influence sites upstream of the ungauged site.
- All artificial influence sites upstream of the most downstream non-nested impounding reservoir(s) to the site are excluded from the estimation procedure.
- The site level abstraction and discharge profiles are summed to a net monthly influence profile at the ungauged site.
- If there is more than one non-nested upstream reservoir, the monthly Release Duration Curves (RDC) are summed to give a set of total RDC at the ungauged site.
- If there are complex influences in the non-impounded catchment, the 12 101 point Monthly Impact Duration Curves (IDCs) are interpolated from the 26 point Annual IDC for each site and summed if there is more than one.
Further details are provided below for groundwater abstractions and impounding reservoirs.
Groundwater Abstractions
The Theis solution has been adopted to determine the impacts of groundwater abstractions on nearby surface waters by the development of monthly Stream Depletion Factors (SDFs). The implementation of this procedure in Qube is summarised by the following steps:
- A monthly profile for the site (a sum of the site purpose level profiles).
- The Storativity and Transmissivity values are identified from either the groundwater unit global values or user updated site specific values.
- The distance of the borehole from the stream is calculated automatically by Qube.
- With these inputs the analytical solution is run for a sufficient number of years (50) to ensure the solution has reached equilibrium.
The appropriate 12 calendar month SDFs are extracted from the from the last years of simulation and rescaled by the mean monthly abstraction volume, to generate the 12 monthly impacts of the abstraction on surface flows.
These 12 monthly impacts are summed with monthly profiles from surface water abstractions and discharges to get a net influence profile for the target catchment.
Impounding reservoirs
The impacts of an impounding reservoir are incorporated within Qube using the following steps:
- For the any impoundments that lie within the ungauged catchment, those that lie non-nested immediately upstream of the ungauged site are identified and their catchments defined.
- The natural flows (not LDG adjusted) for the impounded catchment(s) is calculated to enable the calculation of the impact of each impoundment.
- All influences that lie within the impounded catchment(s) are then identified and discounted from the list of influences above the ungauged site of interest.
- The incremental catchment is defined, which is the catchment that lies between the location(s) of the impounding structure(s) and the ungauged site of interest (Figure 1).
- The annual mean flow is calculated for the incremental catchment using the RUNOFF grid values for the incremental catchment and the area of the incremental catchment. The ratio of the incremental catchment mean flow and the whole catchment natural mean flow is used to rescale all of the FDC statistics to yield a set of annual and monthly FDCs and Mean Flows for the incremental catchment. The normalised FDC (i.e. the estimates of FDCs as a percentage of the relevant MF) stats are those for the whole catchment. The Lake adjustment procedure is not applied as water bodies upstream of the reservoir will not influence the natural hydrology of the incremental catchment.
- The release duration curves for the impounding reservoir(s) are then treated as “discharges” and are added to the flows from the incremental unimpounded catchment.
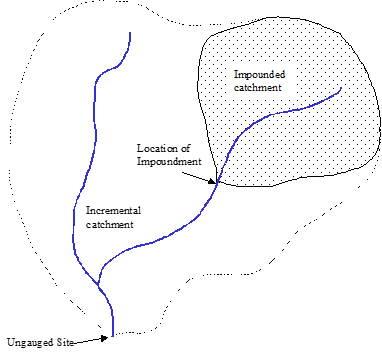
Figure 1 - Schematic representation of the treatment of impounding reservoirs
Estimation of Influenced Flow Statistics
Once the natural low flow statistics have been derived, the nett monthly influence profile for the upstream artificial influences constructed and the net release duration curves developed, the impacts of the influence can be incorporated into the natural monthly flow statistics. These influenced monthly flow statistics can then be re-combined to give annual influenced estimates.
Influenced Monthly Flow Statistics
The influenced monthly mean flow and FDCs are calculated as follows:
- The natural monthly mean flow and FDCs are estimated for the ungauged catchment. If one, or more, impounding reservoirs lie within the catchments then the natural flows are estimated for the incremental catchment, as described above.
- Sum the (non-impounded scaled) natural monthly flows and the cumulative abstraction and discharge monthly influence profiles for each flow percentile and mean flow. Abstractions profiles have a negative sign whilst those for discharges have a positive sign.
- Sum the mean flow and FDCs from Step 2 with those of the RDCs for the impounding reservoirs, if present.
- Sum the mean flow and FDCs from Step 3 with those of the IDCs for complex impacts, if present.
- As some abstractions may exceed the natural flows resulting in a negative influenced flow, all negative FDC percentiles and mean flows are set to 0.00001 m³/s.
Influenced Annual Flow Statistics
The artificially influenced annual mean flow is then calculated as the average of the twelve adjusted monthly flows.
The final step is to disaggregate the 12 101 point influenced monthly FDC into an annual 101 point FDC using the approach used for the Estimation of the Natural Flow Statistics. The influenced annual flow duration curve is derived by ranking the 1212 flow values (derived from the 12 monthly 101 point monthly FDCs) in order of decreasing size. The annual probability of exceedence, P(x), is then calculated for each of the 1212 flows using:
where x is the rank
The artificially influenced annual FDC is the resultant composite curve derived by plotting the flows against the corresponding exceedence percentiles. The 101 points of the annual FDC are then interpolated using a log normal distribution from the composite curve.