Please note that Residual Flow Diagrams are only visible to regulator users (due to data rights).
What is a Residual Flow Diagram
A Residual Flow Diagram (RFD) represents a hydrological "snapshot" of the total quantity of water in a river or stream for any location on the river for a chosen flow condition. The diagram illustrates the relative composition of flow at any point in terms of natural and artificial components.
The principal structure of the residual flow diagram comprises a horizontal axis that represents the line of the principal channel. Distance from source, or any other starting point, is measured from left to right. The vertical axis represents the total flow of the river as represented by your selected flow statistic.
Defining the Residual Flow Diagram Stretch
Right click on the map in the vicinity of your catchment and select 'residual flows'. You are then presented with the following residual flows window. Click on the map to define the upstream and downstream points of your required RFD stretch.
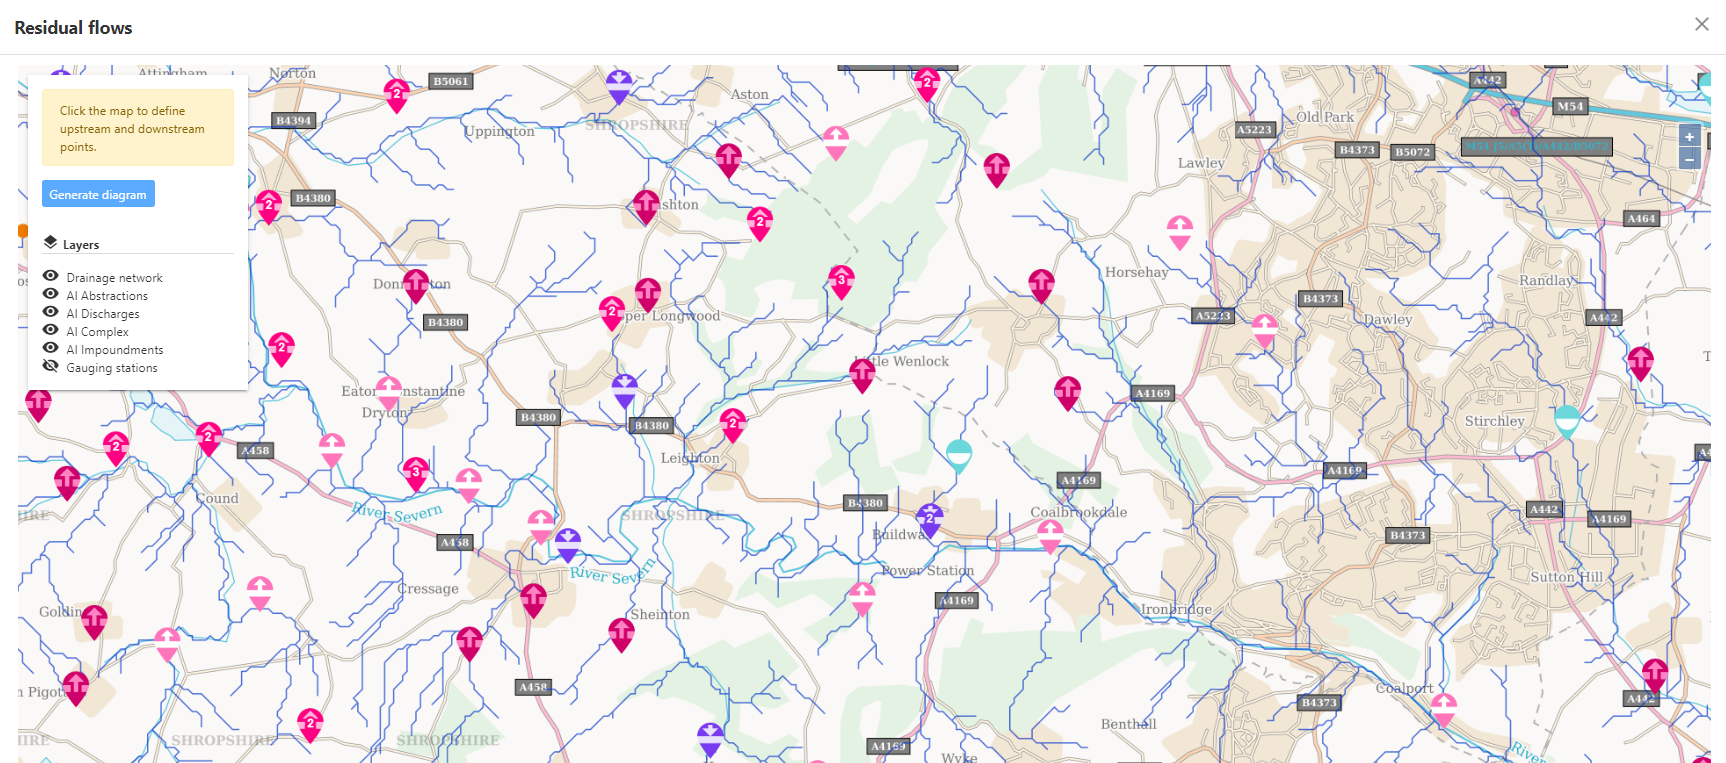
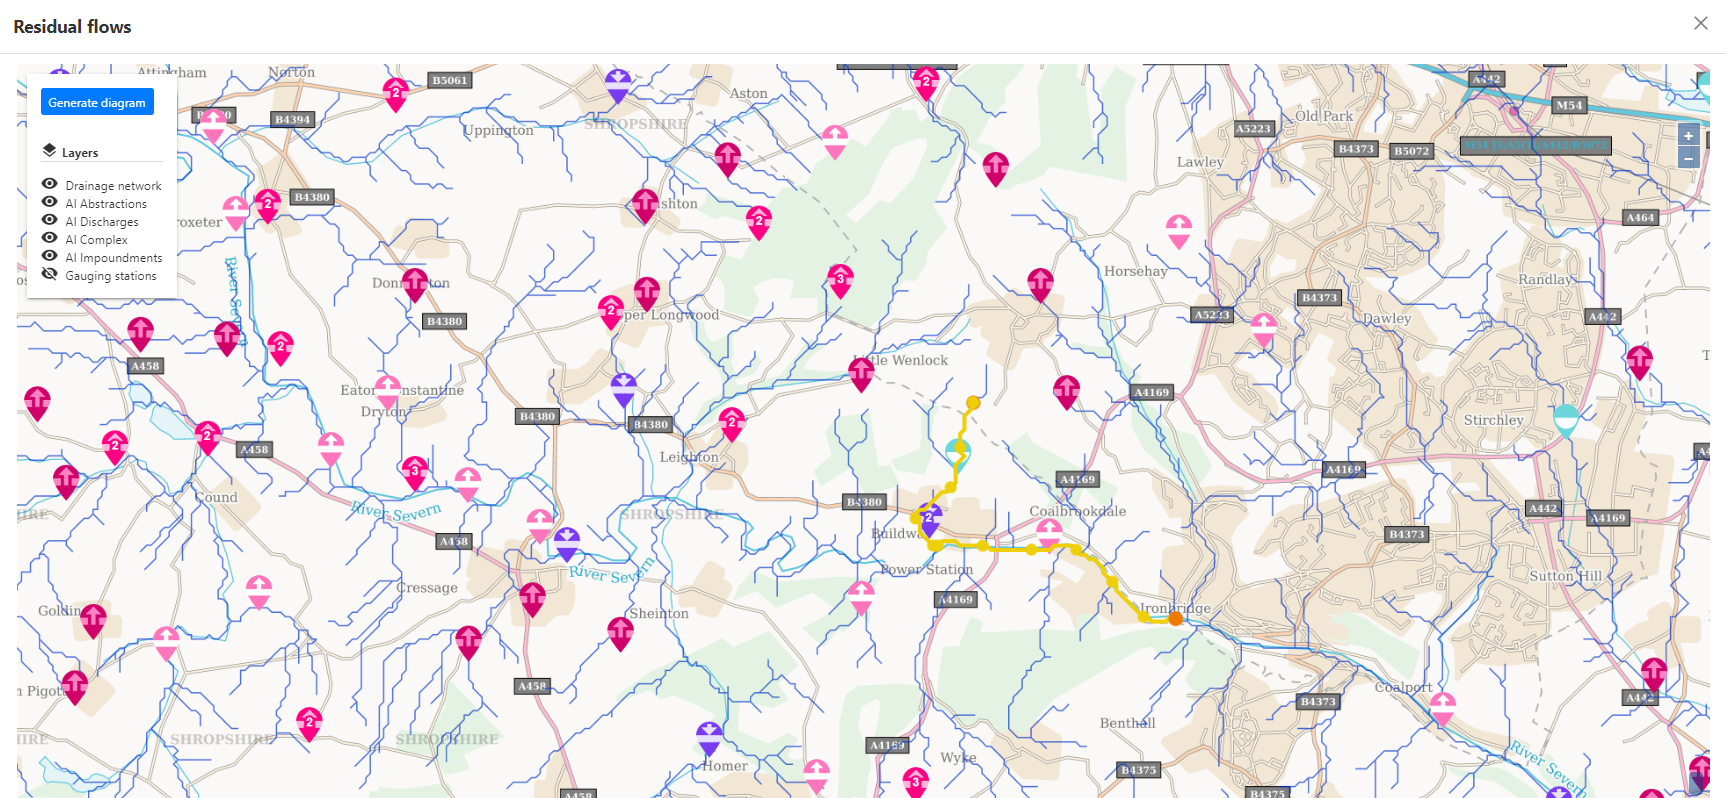
The route between the upstream and downstream points on the map will be automatically identified. Taking the total accumulated natural catchment area between the upstream and downstream points, the RFD will be divided into a number of points. The points along the route represent the catchment outlets where flow results will be presented within the RFD. The accumulated area between each point is determined by the total accumulated catchment area divided by the number of points. Each point therefore represents an equal proportion of the accumulated catchment area.
The drainage network from the upstream to downstream points is highlighted to illustrate the route. Note that the drainage network is formed of polylines between confluences, therefore the route will be highlighted from the confluence upstream of your upstream selected point to the confluence downstream of your downstream selected point. It is the points themselves that represent the catchment outlets for which the results will be generated within the RFD.
Click 'generate diagram' to name and submit your request.
Note: If the points selected are not nested on the same drainage network, you'll be asked to reselect your upstream and downstream points on the map. You'll also get an error if the points selected are too close.
Processing the results
Once you have submitted your request, the notification bell will update you with progress on generating the results.
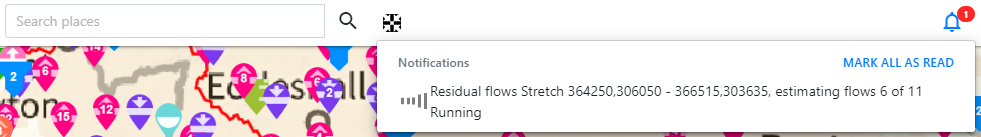
You will then get a notification when the results are ready to be viewed.

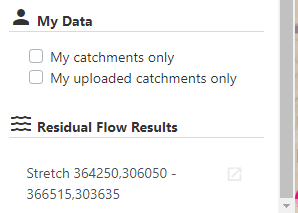
Results
To view your results, you can either click on the notification or the Residual Flow Results in the side bar.
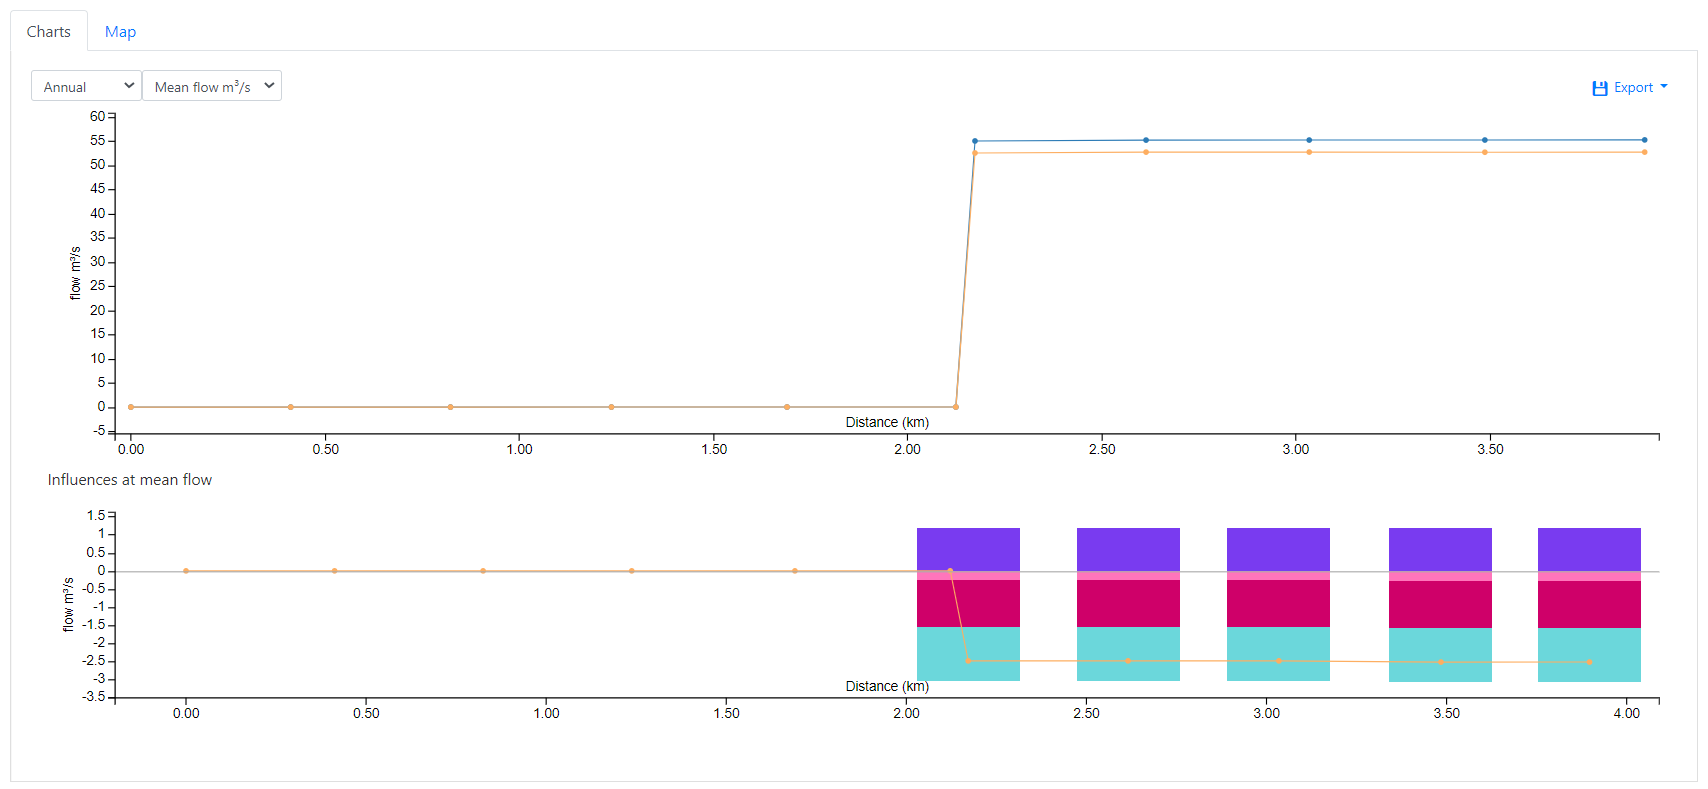
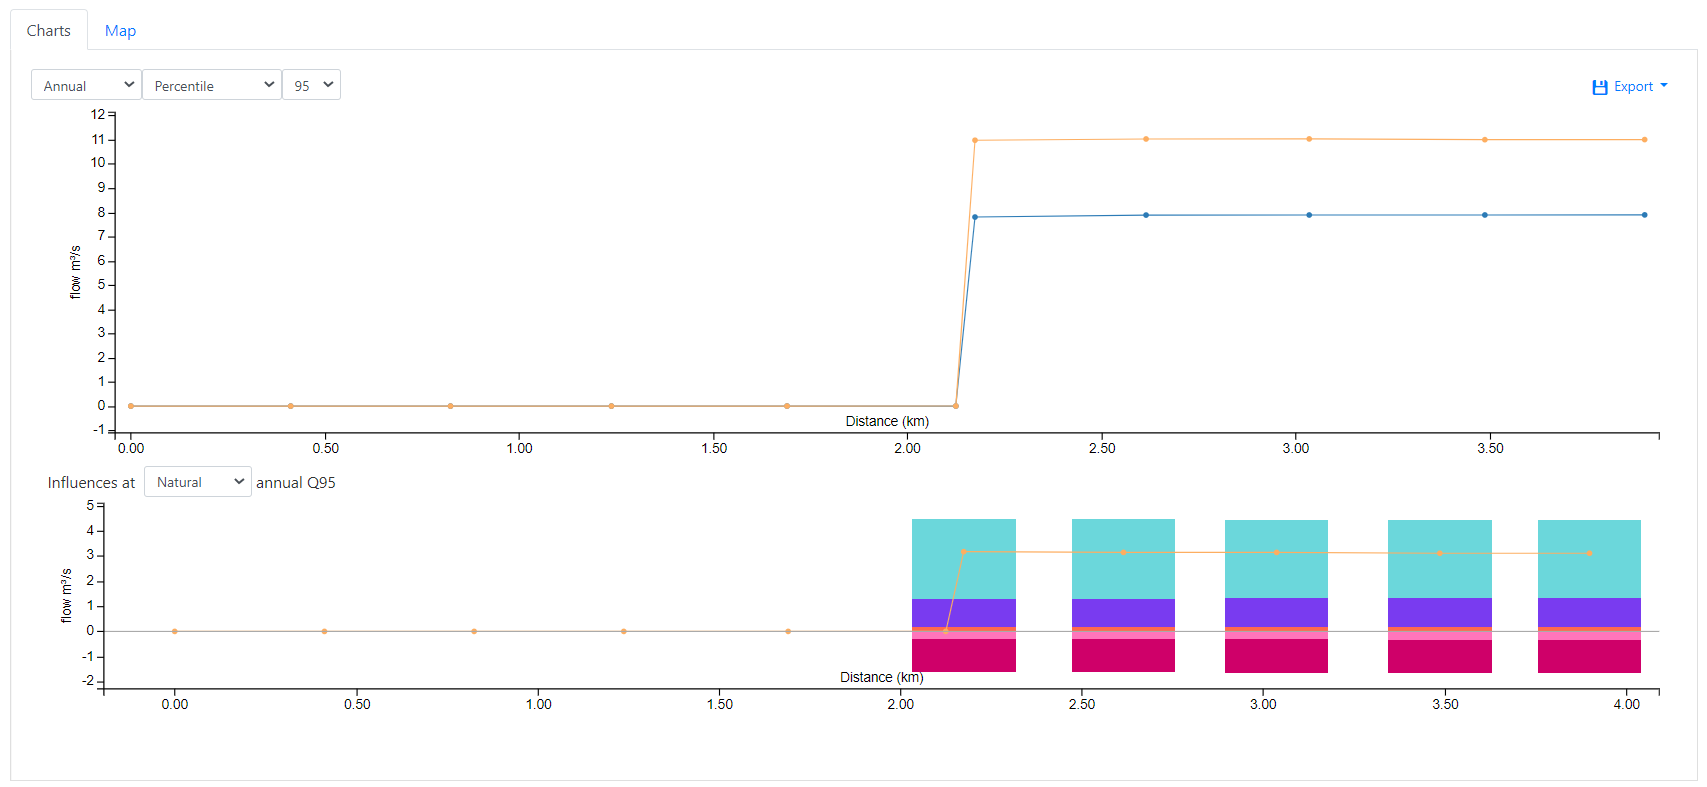
Charts
The Charts tab first presents the natural (blue) and influenced (orange) flow for the selected flow statistic against distance downstream. The second chart then presents the total influence by feature type at each point for the selected flow percentile, along with the difference between the natural and influenced flow.
These results can be presented for the annual or monthly mean flow and selection of flow percentiles. The below shows examples of annual mean flow and annual Q95.
As described in Differences in influences at natural and influenced percentiles below, the influences can vary when considering the influence at the natural or influenced flow percentile. The second chart therefore provides the option to display either for the flow percentiles.
The exported csv file and Map tab present the results for the flow statistic selected on the Charts tab.
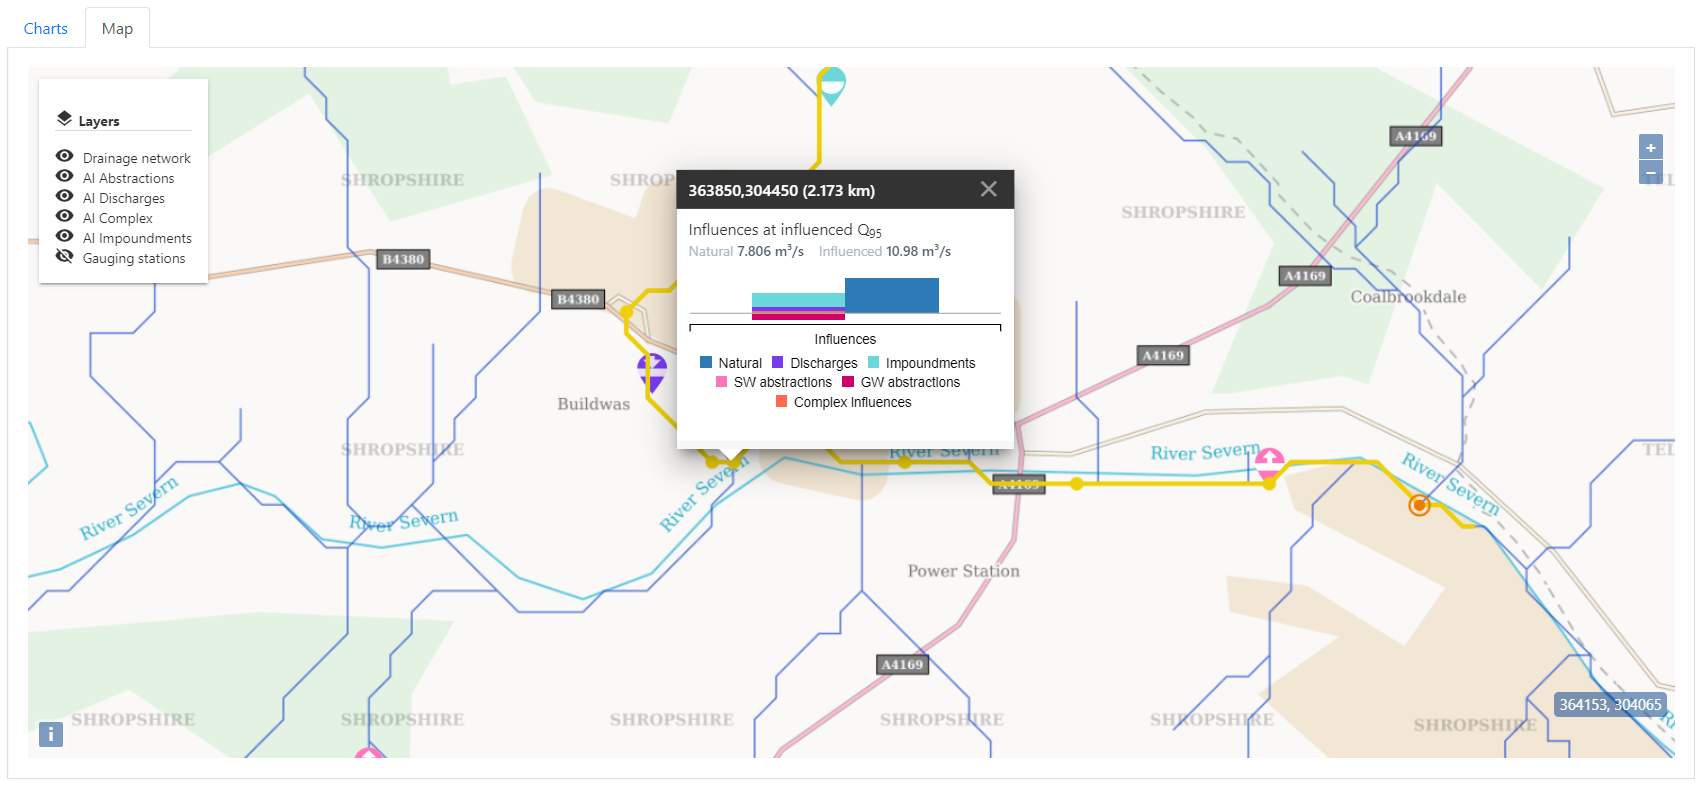
Map
The Map tab presents the RFD route and points highlighted on the drainage network, along with artificial influence features and gauges. The point hover over presents the natural and influenced flow, as well as a summary artificial influence stacked chart, for the flow statistic selected on the Charts tab.
Differences in influences at natural and influenced percentiles
For artificial influences that vary temporally (e.g. a spray irrigation abstraction or a release from an impounding reservoir), the resulting influenced flow for a given natural flow percentile can correspond to a quite different influenced flow percentile. This is described and illustrated below in Charts 1 to 4:
- Chart 1 presents the 101 point natural annual FDC, as well as the 12 x 101 FDC monthly natural flows against their corresponding annual flow percentile. You can see how these natural flows line up along the same curve.
- Chart 2 illustrates the 12 x 101 natural and influenced flows against the annual natural flow percentiles. Within the influenced flow estimation procedures, each of the 12 x 101 FDC monthly natural flows are combined with the artificial influences for the corresponding month and flow percentile. In this example, the natural annual Q94.97 flow occurs in October, whereas the Q95.22 occurs in July, therefore you can see how the temporally varying influences can impact quite differently on flows around Q95.
- Chart 3 illustrates how each of the influenced flows are reordered by descending flow to be plotted against the influenced percentile. For each of the 12 x 101 influenced flows, Qube stores its original natural annual and monthly percentile and its reordered influenced annual and monthly percentile to enable the influence at either the natural or influenced percentile to be displayed in the RFD.
- Chart 4 finally presents how the annual influenced FDC is interpolated from the 12 x 101 monthly influenced FDC. For the RFD, the influence at each of the 101 annual percentiles is the average of the artificial influences at monthly flows with an annual natural or influenced percentile within \pm 0.5 \%.
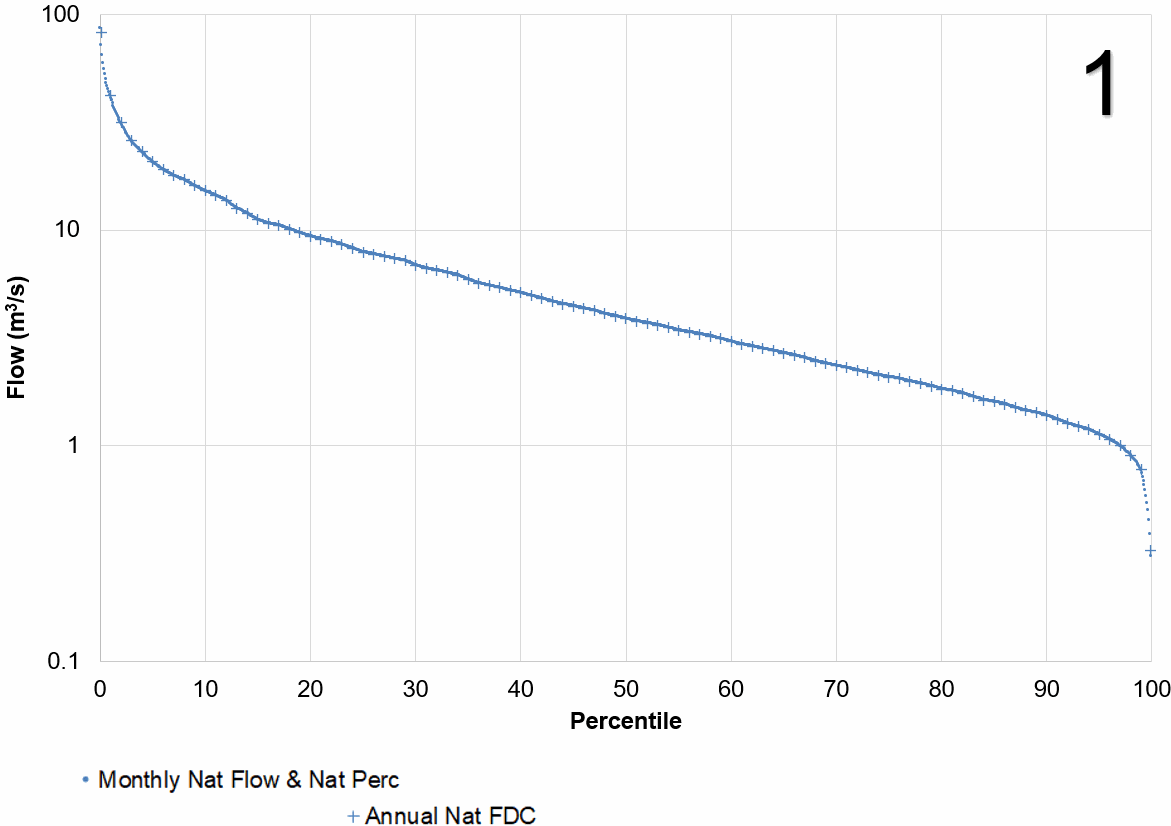
Charts 1 to 4: Illustrating the influencing of natural flows described above via a cycling image