Getting started
Log in and go to the map screen.
Tip: you can have Qube open in multiple tabs or windows if you want to compare data or come back to results later.
Note: Repeated failed password attempts results in the account being locked, but only for 30 mins. This is necessary safeguard to prevent against brute-force password attacks.
Using the map
-
Pan left/right, up/down using the mouse
-
Zoom using your mouse wheel, or the plus and minus signs at the top right
-
Click and drag to define a rectangle, then release the mouse to zoom the map to the selected region
-
Use the search bar to search the map by catchments, place names, influence site names, or gauge names
-
Enter numeric or national grid references into the search bar

Viewing layers
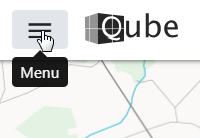
Click on the menu to view the layers.

From the menu you can:
- Save a copy of the map as a PNG image

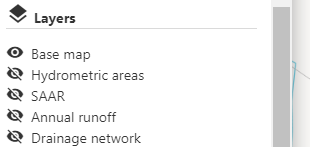
- Show/hide layers

- Show/hide 'my' data

Tip: the default is to displays all catchments within your organisation. You can select to only show 'my' catchments.
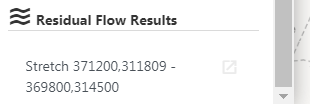
- Open recent residual flow results

Tip: this shows your recent residual flow results - you'll need to create again if no longer in this list.
Please note that residual flow diagrams are only visible to regulator users (due to data rights).
Getting flow estimates and data
Right click for the map to get options for that location:
Grid info at XXXXXX,YYYYYY
- Get grid information (e.g. hydrometric area, runoff, rainfall, evaporation) at the point location.
Define catchment
- Define a catchment boundary for flow estimation.
The location of the catchment outlet will jump to the nearest point on the drainage network. Tip: make sure the drainage network layer is visible first.
Residual flows
- Define a reach for residual flow estimation
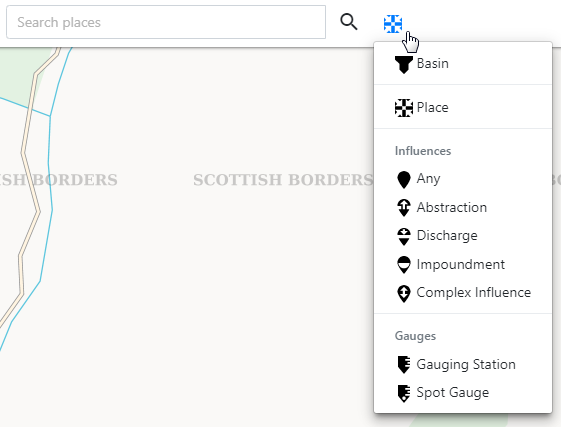
Add feature
- Create a new artificial influence feature or gauge.
Upload boundary
- Upload a catchment boundary shape file for flow estimation.
Notifications
The number on the bell will alert you to unread notifications. Click on the bell to view them.
