Please note that gauge details are only visible to regulator users (due to data rights). You require read/write permissions in the Staging System to create, edit or delete gauge data.
Finding a gauging station
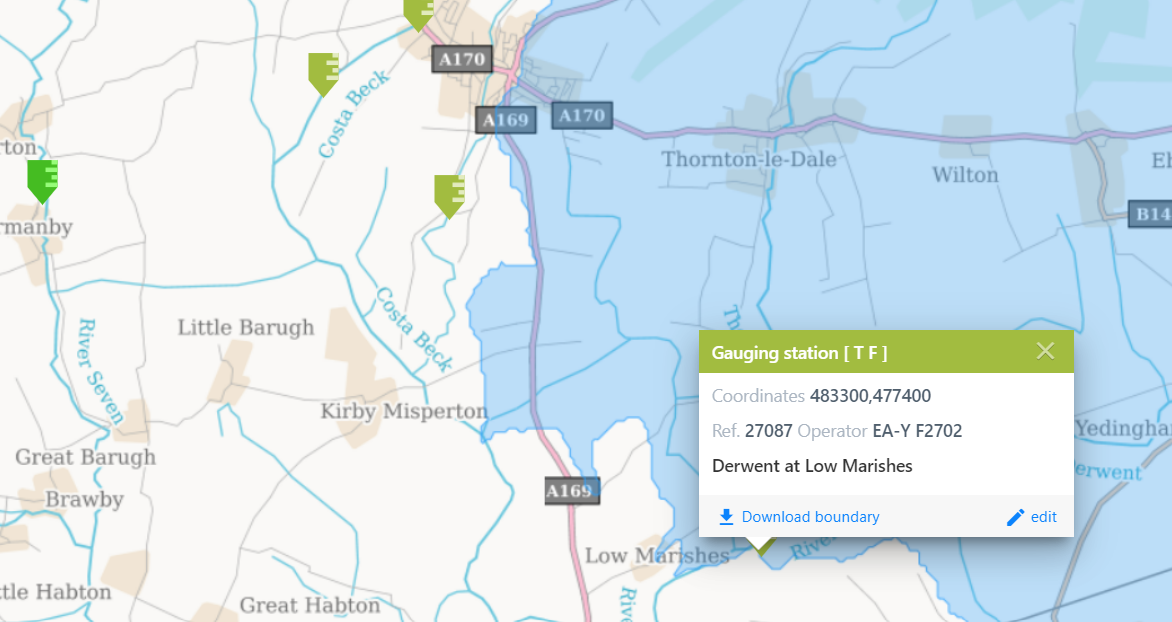
When you search for a gauging station or select a gauge icon on the map, summary information is provided in the popup and the catchment boundary is displayed. The colours and the symbols of the icons differentiate between local data gauges and those that are sourced from a groundwater model. These are also indicated at the top of the popup window, where:
- T: gauging station with timeseries data
- F: gauging station with flow duration data
- L: gauging station is suitable for local data
- G: gauging station with flow duration curve from a groundwater model
Reviewing a gauging station
Once you've selected a gauging station you can view the information stored for that site. If you've Organisation Admin Rights then you'll need to select 'edit'.
The gauging station window contains summary catchment statistics, gauging station details, flow duration curves and time series.
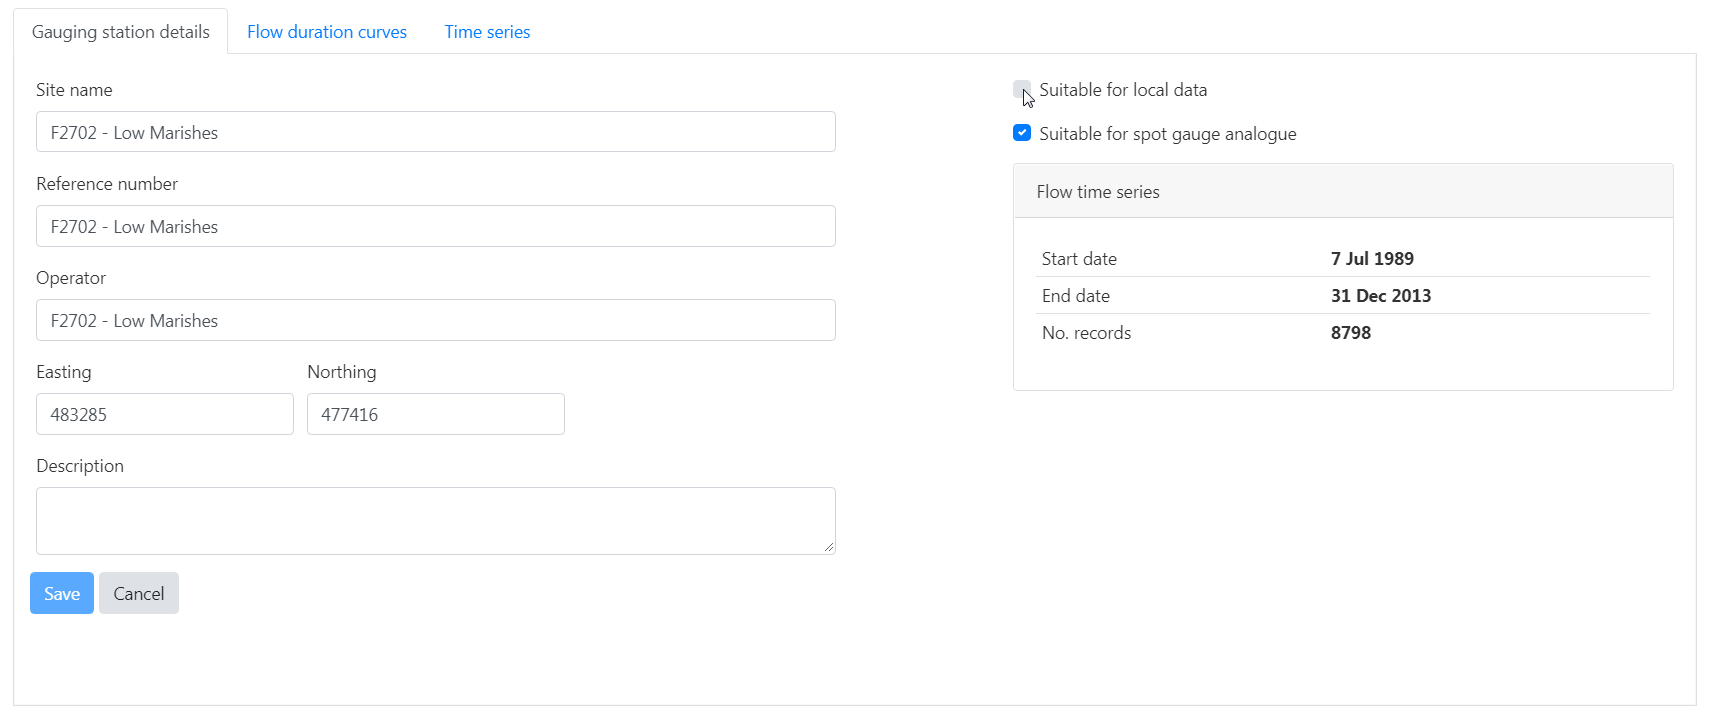
Gauging station details
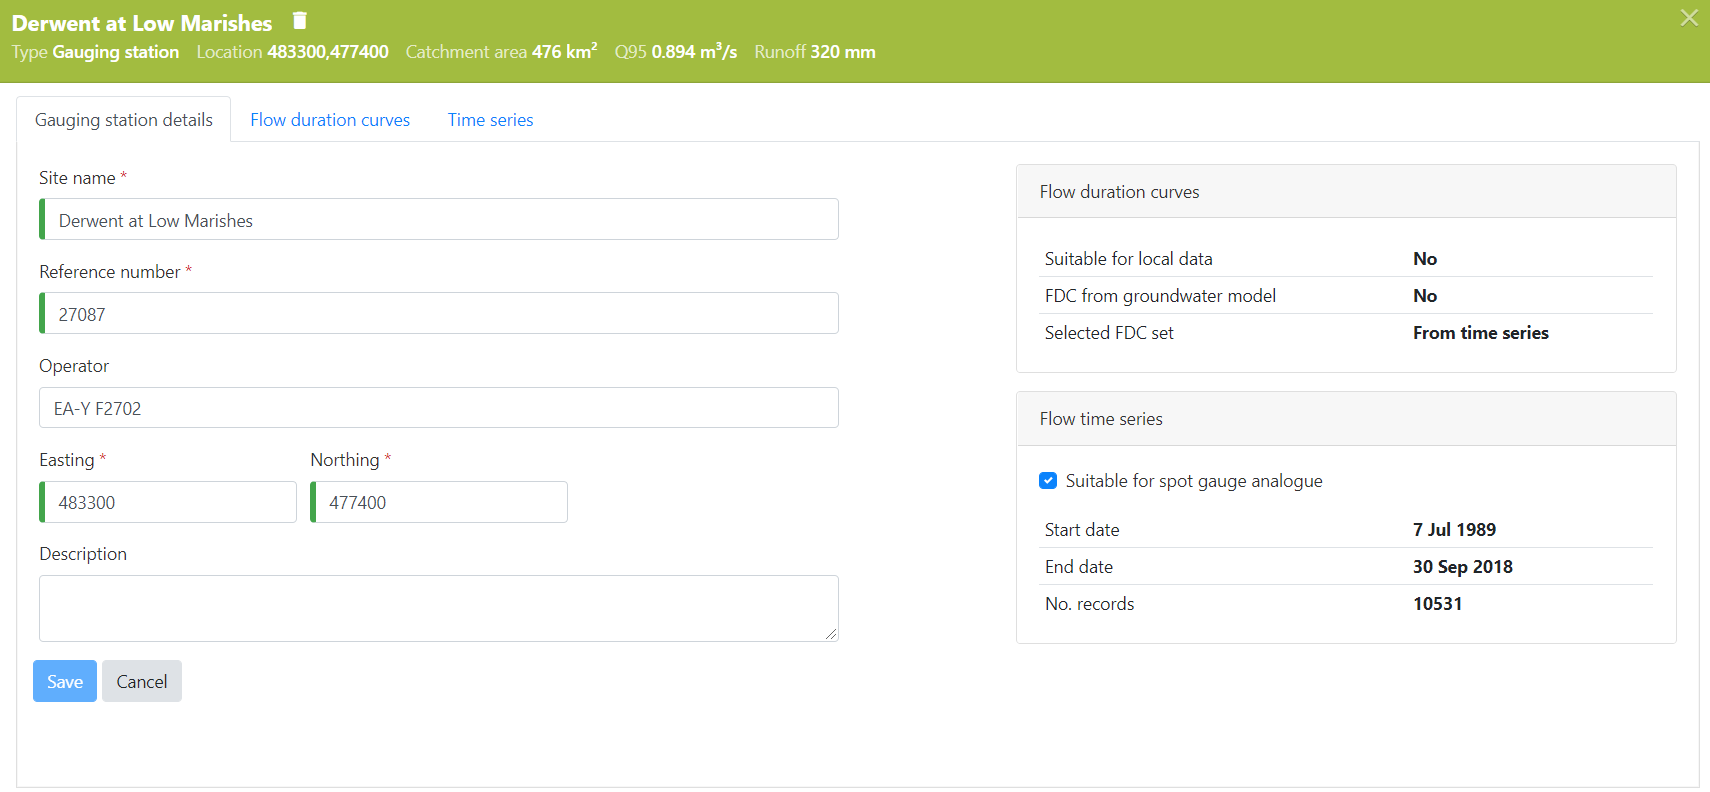
With FDC's selected for use as local data under the flow duration curves tab, the gauging station can be selected for use as a local data gauge.
With a suitable time series loaded under the time series tab, the gauging station can be selected as suitable for use as an analogue for spot gauges.
Flow duration curves
The FDC's are generally available as a pair of naturalised and observed FDC sets. A FDC set is generally comprised of an annual and 12 monthly FDC's (although as only the annual FDC is utilised in the Local Data Algorithm, you can just upload naturalised/natural annual FDC).
FDC's are automatically derived using all data (no missing data criteria applied) from the uploaded time series. A minimum of 2190 values (6 years) is applied.
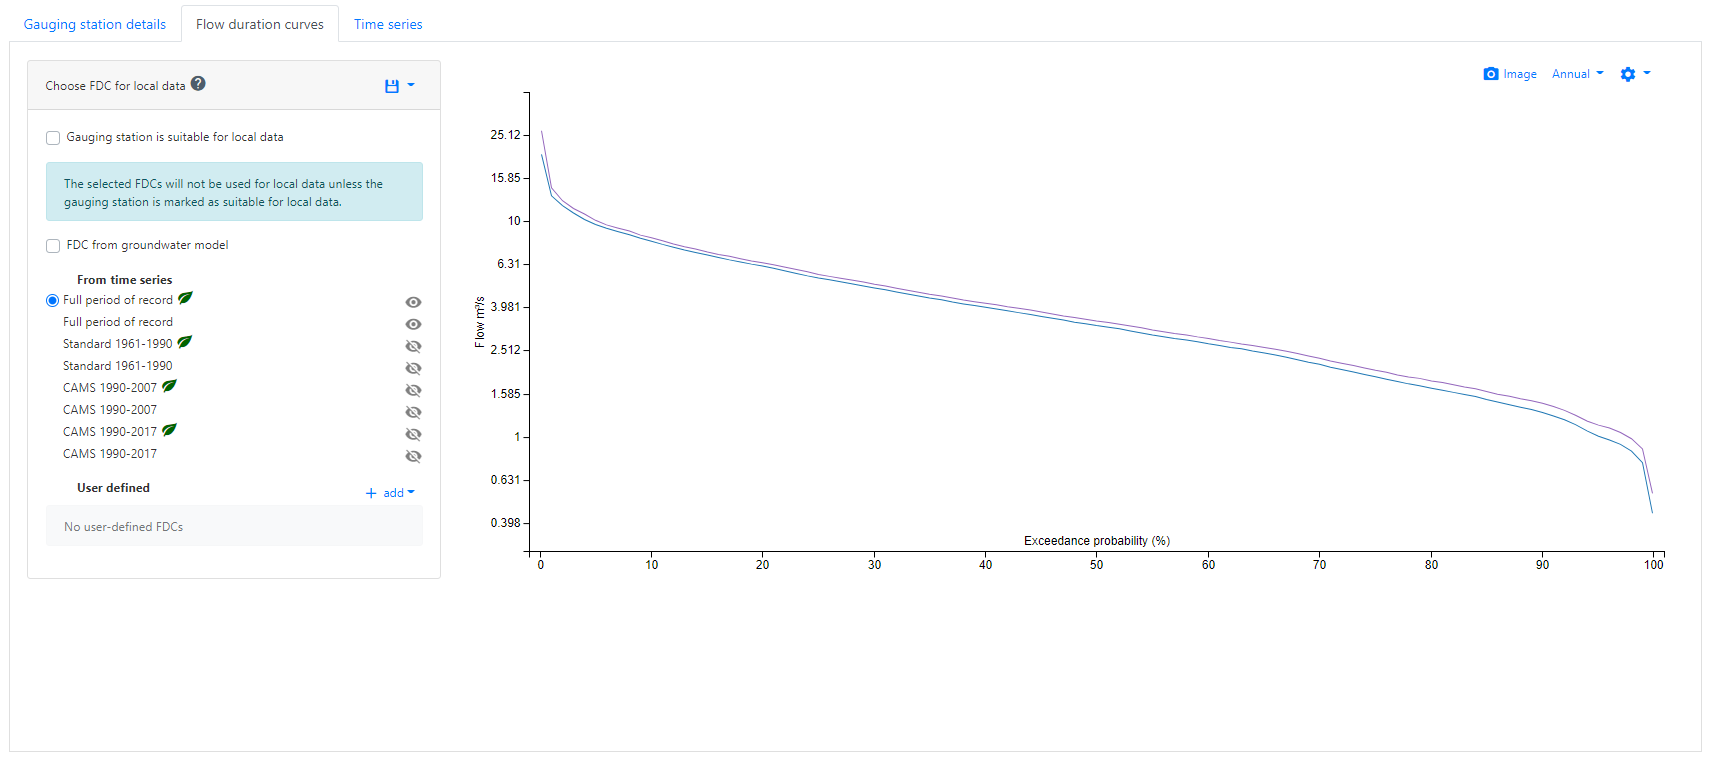
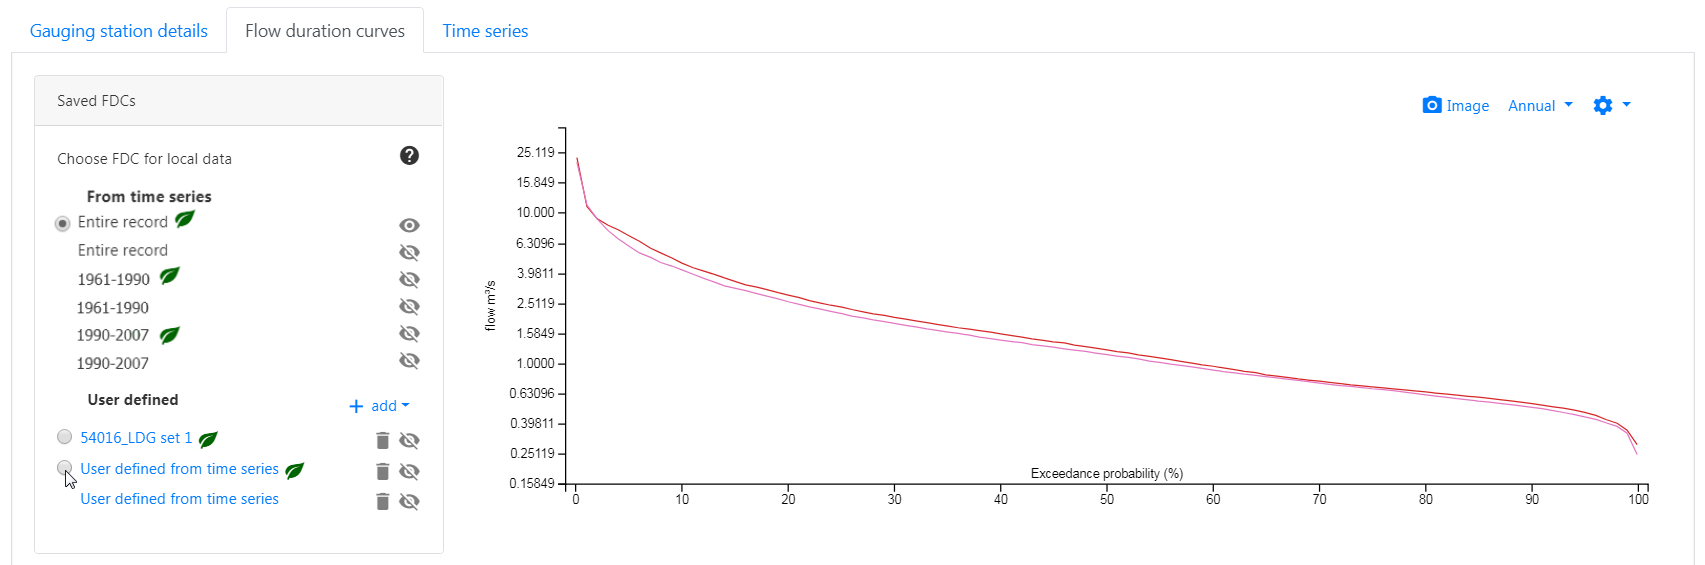
As default, the full period of record is used. If your organisation has selected to have alternative period of records available for their users, FDC's are automatically calculated from the time series for those period of records (applying the same minimum data criteria).
You can select any FDC to review on the chart. Details of a user defined FDC are shown if you hover over the FDC name hyperlink. Click on the name to view/edit all details.
Uploading a user defined FDC
Select 'add' to upload a FDC from a file and enter the FDC details and choose a file to upload. You can upload an annual FDC or a set of annual and monthly FDCs. Sample and blank template import files are available to download here: annual only sample, annual and monthly sample, annual only template, or annual and monthly template.
You need to select whether the FDC is gauged or naturalised:
- Gauged - This should generally be used as default. You will have the option to then naturalise this FDC using the artificial influences within Qube.
- Naturalised - This should be used for natural estimates of the FDC (e.g. from groundwater models). Caution should be applied when uploading FDC that have been naturalised outside of Qube, as this may lead to inconsistencies in the representation of artificial influences. If your flows are gauged in a catchment which contains no artificial influences, you should still select gauged and apply the flow naturalisation (which would result in the same FDC). This will ensure any additional influences added are accounted for.
User defined FDC's are only used for Local Data within an estimate when the full period of record of selected (default for all flow estimates).
Creating a user defined FDC from the time series
Select 'add' to create a FDC from the time series and enter the FDC details. This option is only available for gauging stations with a time series loaded. You can select an alternative period of record, where the time series record start and end date is initially populated. By default all available data is used, but you can define a missing data criteria. The FDC from time series are always considered to be gauged.
User defined FDC's are only used Local Data within an estimate when the full period of record of selected (default for all flow estimates).
Flow naturalisation
All FDC automatically derived from the time series contain the gauged and naturalised FDC where there is sufficient data. Any user defined uploaded marked as 'gauged' or user defined from the time series can be naturalised by the user.
Details of the flow naturalisation scientific method can be found here.
To naturalise a user defined FDC:
-
Select a user defined FDC name hyperlink.
-
Click naturalised FDC button.
-
You're then presented with the naturalised FDC and monthly mean flows, as displayed within the main flow estimation screen.
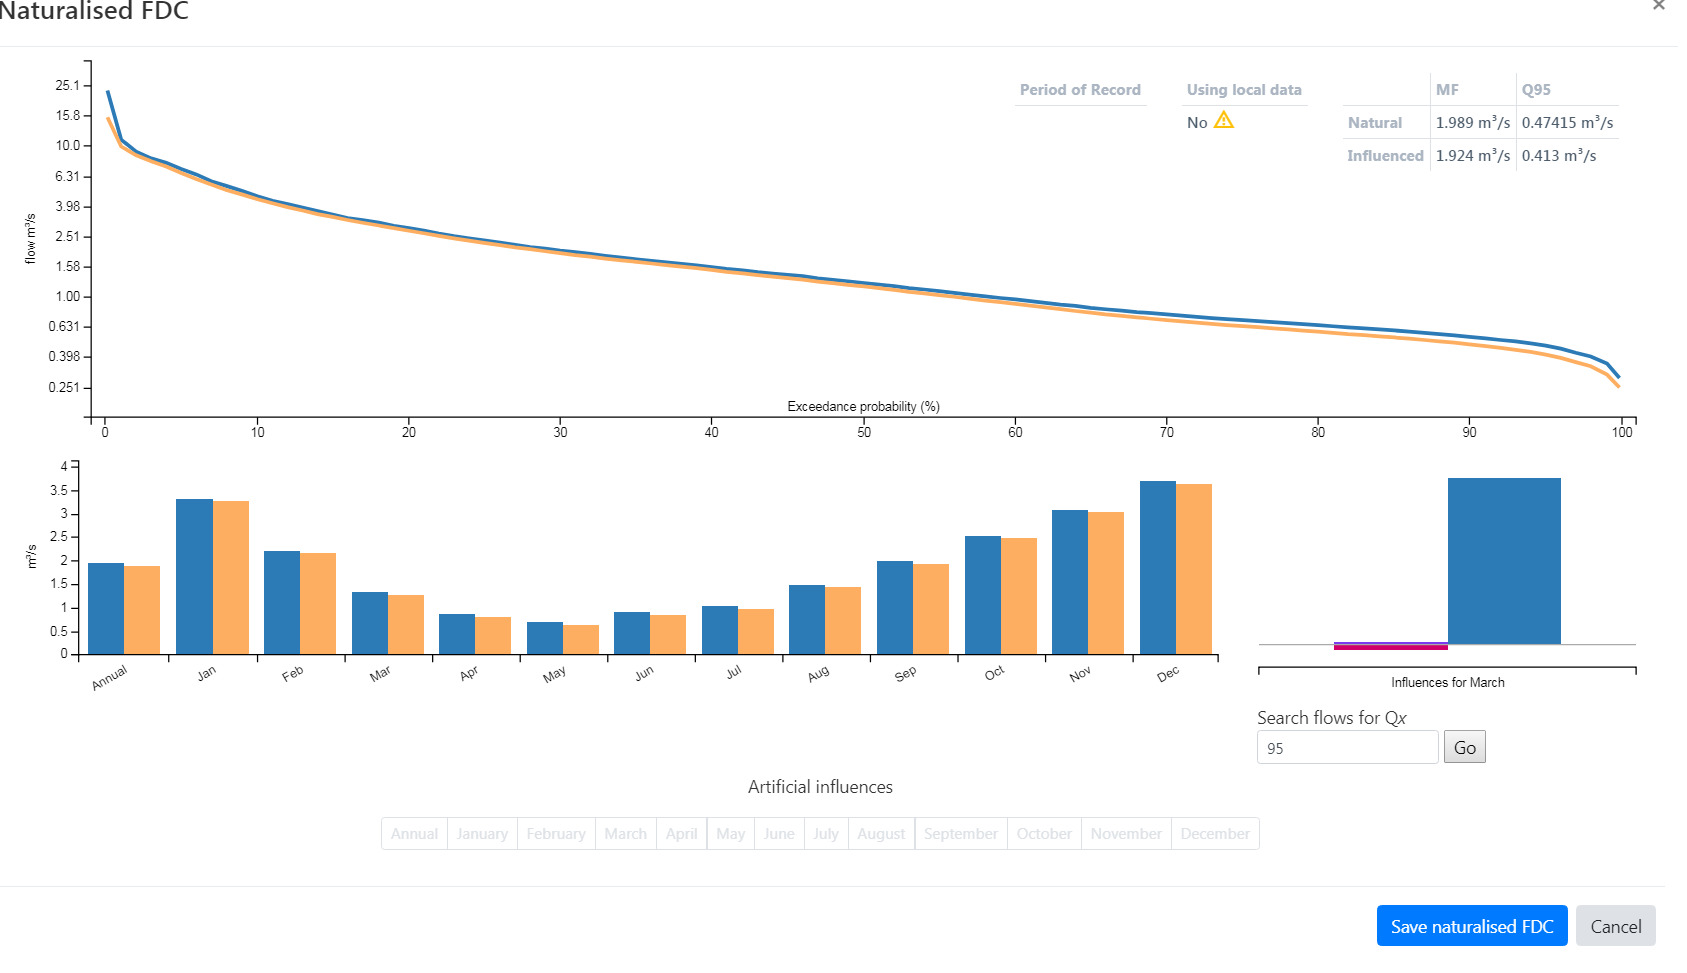
- You can review the artificial influences within the catchment within the Artificial Influences Catchment Report. Select either annual or a particular month to display the following summary artificial influence stacked chart, relative to the equivalent natural flow estimate. Click on the stack chart to go to the Artificial Influences Catchment Report screen.

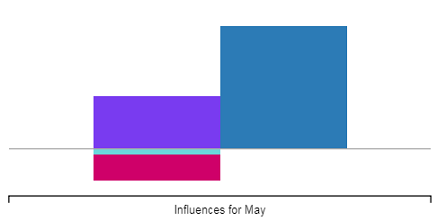
- If you're interested in a given annual flow percentile, you can find which month that flow most occurs in, as follows:
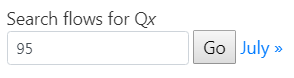 Click on the resulting month link to view the Artificial Influences Catchment Report screen for that month.
Local Data Gauges
Choosing a FDC for local data
Once you have a naturalised FDC (denoted by the green leaf), you can select that FDC for local data. See guidance on Gauge Suitability for Local Data.
Selecting a gauging station as suitable for local data
Only once a naturalised FDC is selected for local data, is the 'Suitable for local data' option available on the Gauging station details tab. This is used to select whether this gauging station naturalised FDC may be used in the Local Data Algorithm.
Time series
Viewing the time series
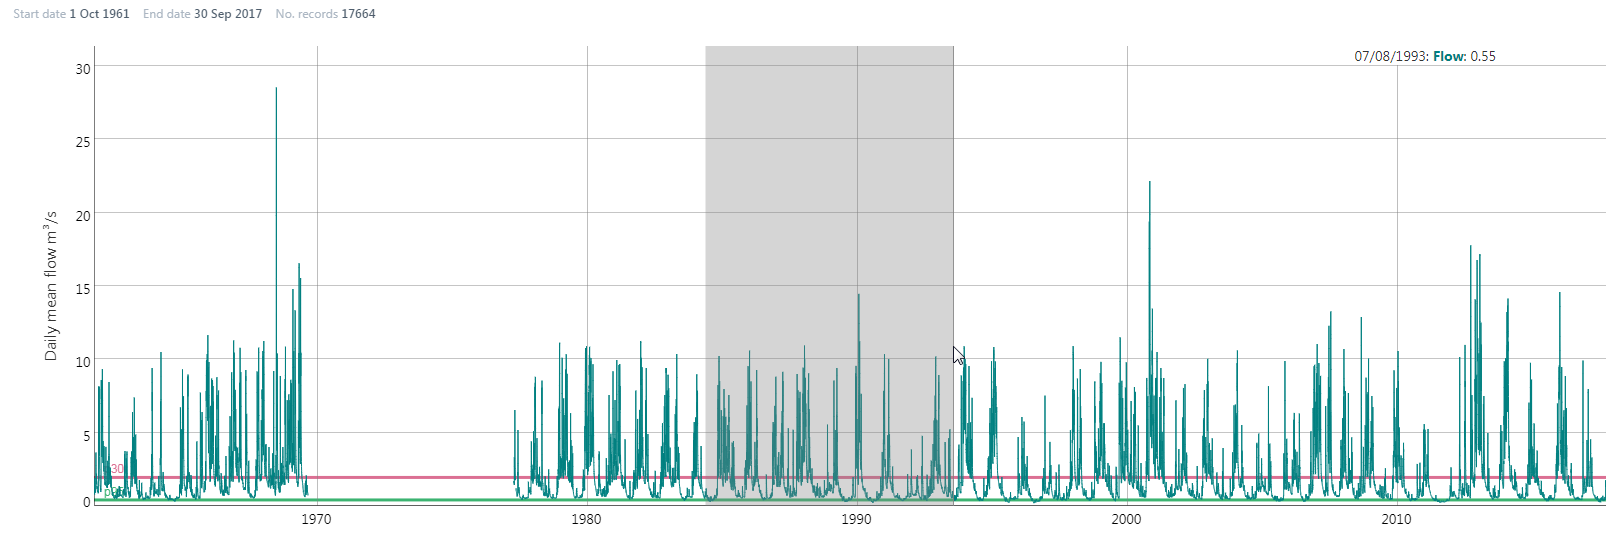
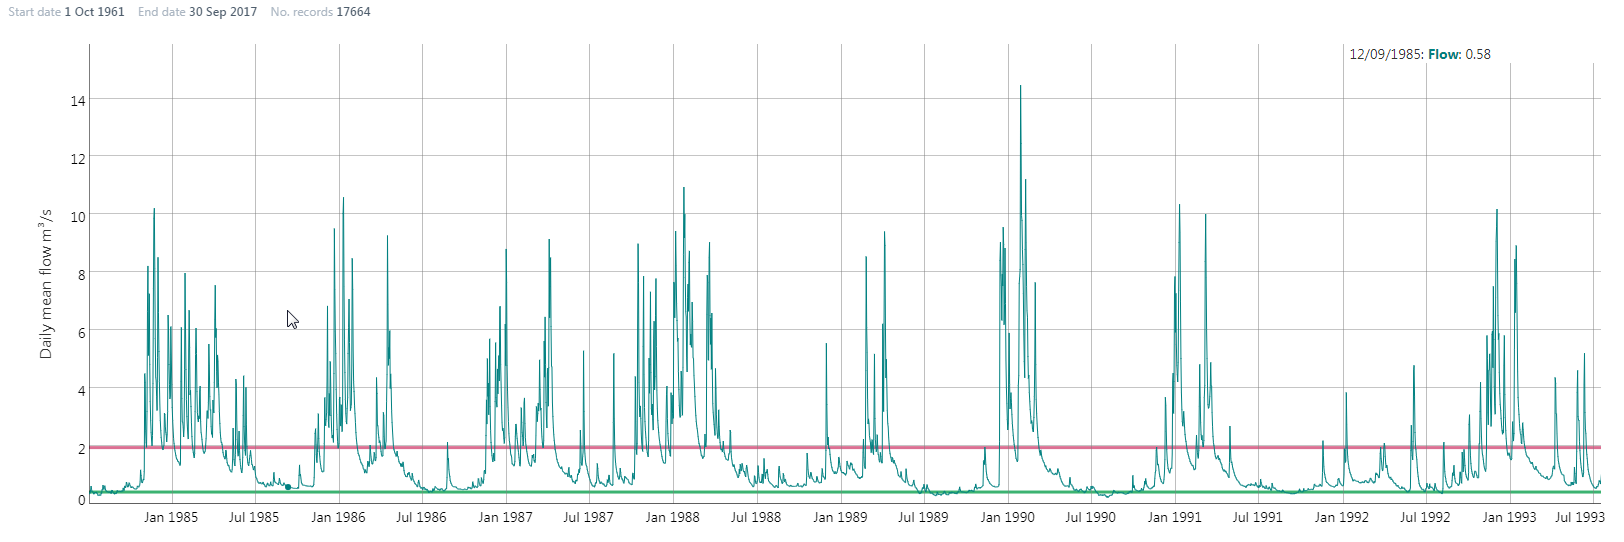
If available the daily mean flow time series will be displayed. Hoovering over the chart presents the date and corresponding daily mean flow.
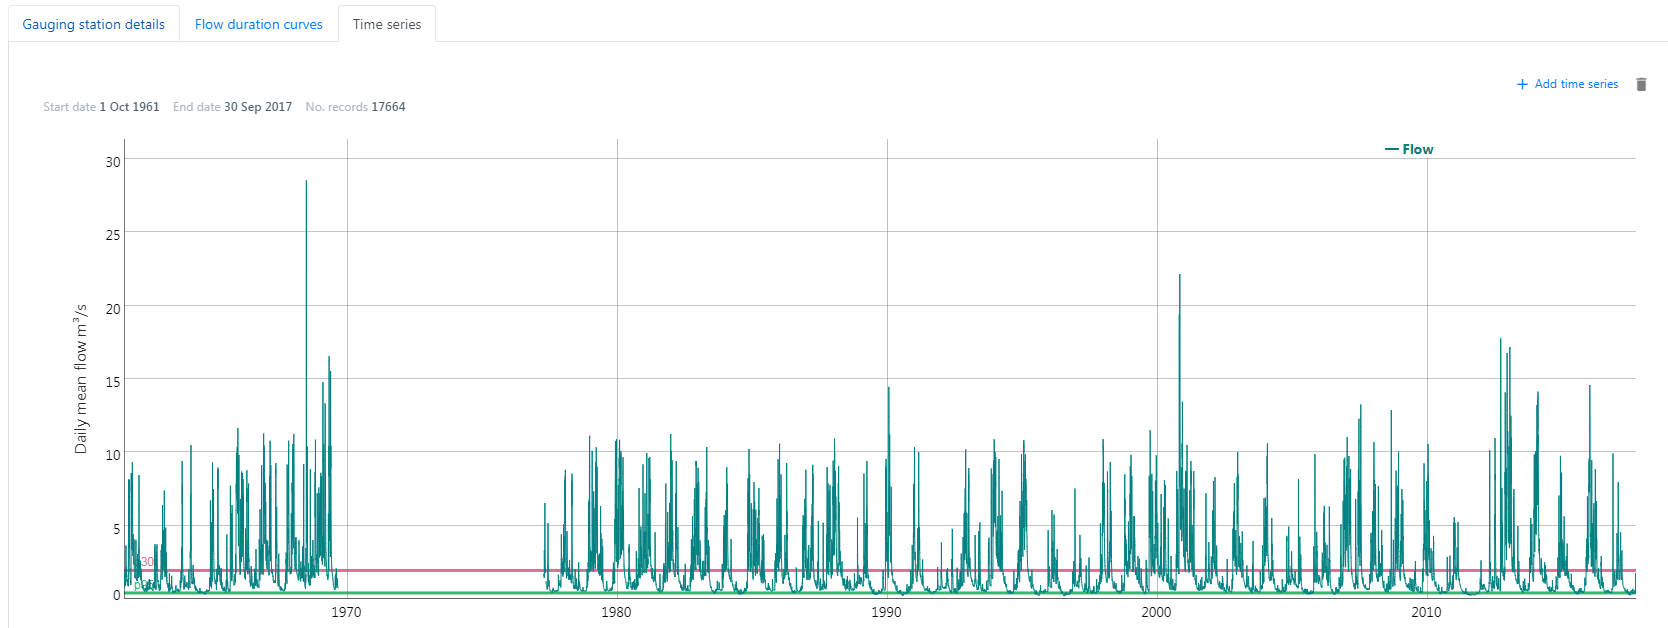
Click, drag and release on the chart to zoom to a selected period. Double click on the chart to return to the full period.
Uploading a time series
Select 'add time series' to upload a daily mean flow time series in either a WISKI XML or NRFA CSV format. Uploading a new time series will overwrite the previous time series. Sample import files are available to download here: WISKI xml sample or NRFA csv sample.
Time series NRFA UK annual update
Following the NRFA UK annual update of daily mean flows, these time series will be loaded into Qube across the UK by WHS.