How to estimate flows
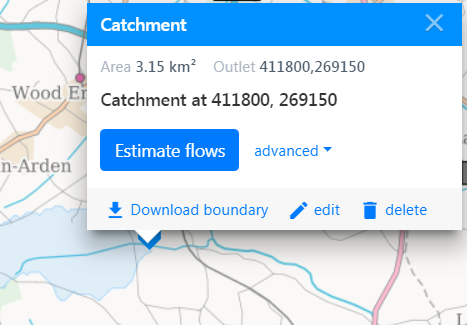
Once you've defined or uploaded a catchment, click on the catchment outlet. Save the catchment if you haven't already.
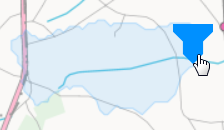
From here you can estimate flows, and download the catchment boundary shapefile, edit the name or delete the catchment.
Advanced settings
As the use of data from all relevant local data gauges is recommended, local data is incorporated within every flow estimate as default. See Local Data Algorithm for further details. You can unselect 'include local data' under the advanced setting.
Use of lake adjustment is available in Scotland and is incorporated within every flow estimate as default. See Lake Adjustment for further details. You can unselect 'use lake adjustment' under the advanced setting.
We recommended you use the full available period of record for flow estimation. Some regulators have selected alternative periods of record to be made available to all Qube users for flow estimation in their country of jurisdiction. These can be selected under the advanced settings.
Flow Results
Once you've selected 'Estimate flows', Qube models the catchment and displays the flow results window, containing catchment summary statistics, flow duration curves, gauges, ROI stations and Time Series.
Read these notes if you are using a user-defined catchment.
Catchment summary statistics
In the UK, the following catchment summary statistics are displayed. Runoff, used to derive annual mean flow, is for the full period of record or the specific alternative period of record if selected for the flow estimate. SAAR and PE are for the standard period of record 1961-1990. The HOST fractional extents and BFIHOST can be displayed within the drop down. Please note that SAAR, PE and HOST fractional extents are only visible to regulator users (due to data rights).

Flow duration curves
The Flow duration curves (FDC) tab presents the FDCs chart, a bar chart of the annual and monthly mean flows and summary artificial influence data.
FDC
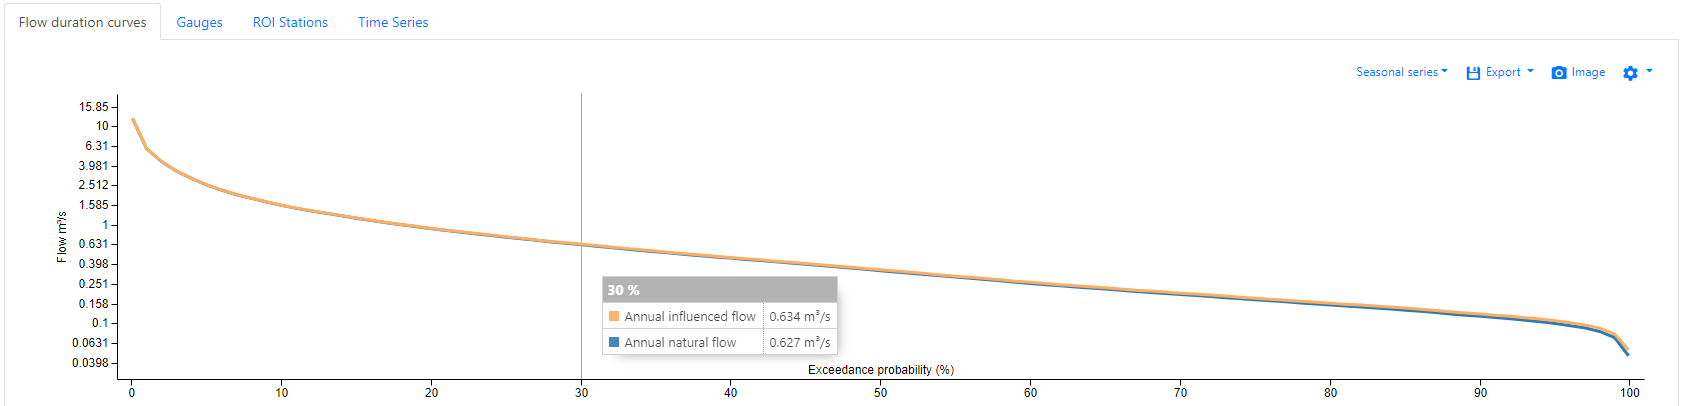
The FDC chart can be saved as an image  , with flow statistics can be exported
  as a csv or xml.
You can change the FDC chart axis (linear, P-Distribution, Log) and flow units (m³/s, % mean flow) via the settings  .
.
Tip: Click on the relevant annual, month, natural or influenced bar in bar chart below to display the associated FDC.
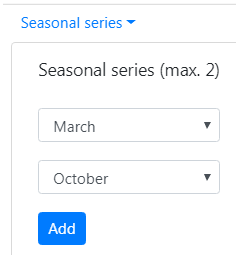
Up to two seasonal series can be added.
Annual and Monthly Mean Flow
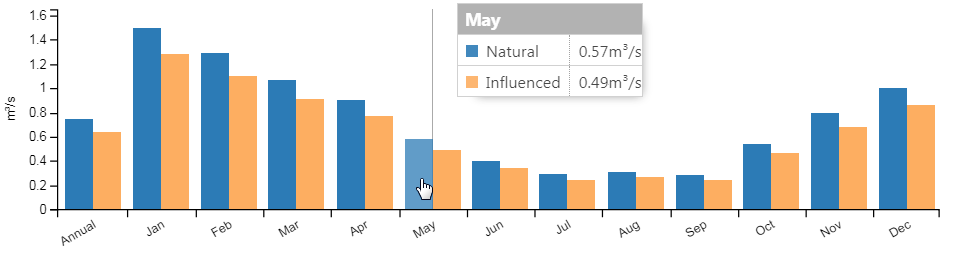
Tip: Click on the relevant bar in bar chart to display the associated FDC above.
When there are no influences present within your catchment, this will just show the natural mean flows.
Artificial Influences
Please note that artificial influences are only visible to regulator users (due to data rights).
When there are influences within your catchment, the following will appear.

Hover over the annual or a particular month to display the following summary artificial influence stacked chart, relative to the equivalent natural flow estimate.
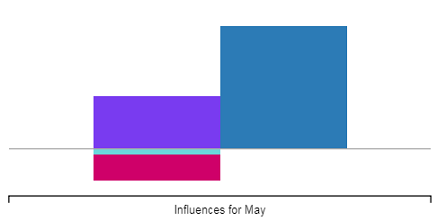
Click on the above influence buttons or the stack chart to go to the Artificial Influences Catchment Report screen.
If you're interested in a given annual flow percentile, you can find which month that flow most occurs in, as follows:
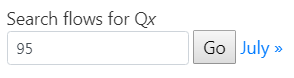
Click on the resulting month link to view the Artificial Influences Catchment Report screen for that month.
Gauges
The Gauges tab presents the local data gauges used within the estimate and any other nearby gauging stations or spot gauges. Selecting in the table, will highlight the gauged catchment on the map. You can also select to plot the gauged FDC on your catchment estimated FDC.
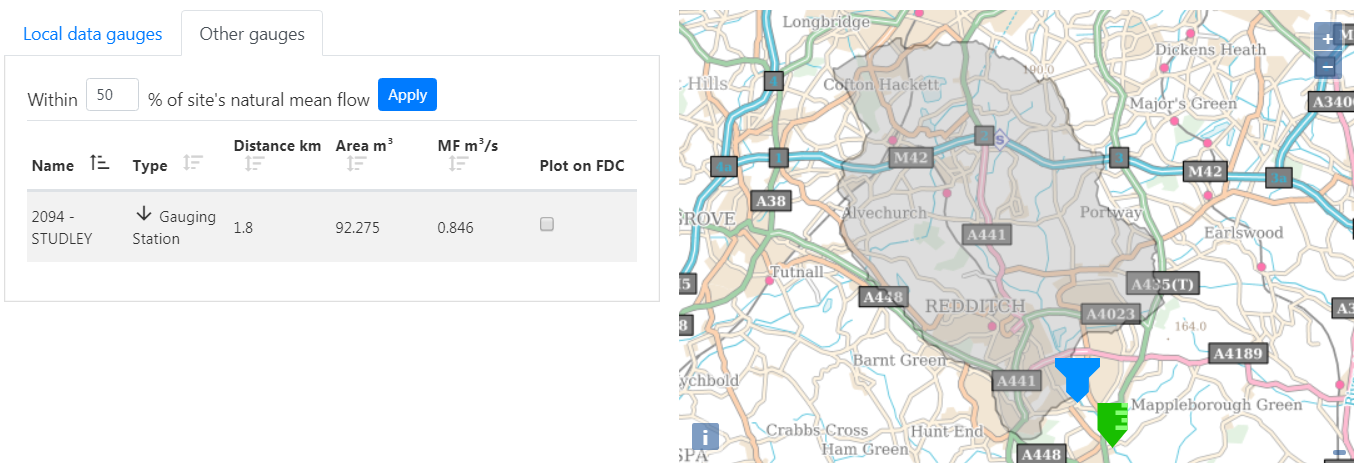
For the other gauges, this is filtered to gauged catchments within 10% of the estimated natural mean flow. You can increase this filter to up to 50%, which would present gauged catchments with a mean flow of between half and double your catchments mean flow.
Note - the gauges tab is not available if you select not to use local data.
ROI Stations
Presents the Region Of Influence gauging stations used within the flow estimate, their weight in the pool and the Q95 as % mean flow for reference.
Time Series
You can generate a Time Series for your catchment based upon the influenced FDC (or natural FDC where no influences are present). Click on the generate time series button.
A daily mean flow time series is generated and plotted. The time series can be exported to csv  . Hoovering over the chart presents the date and corresponding daily mean flow.
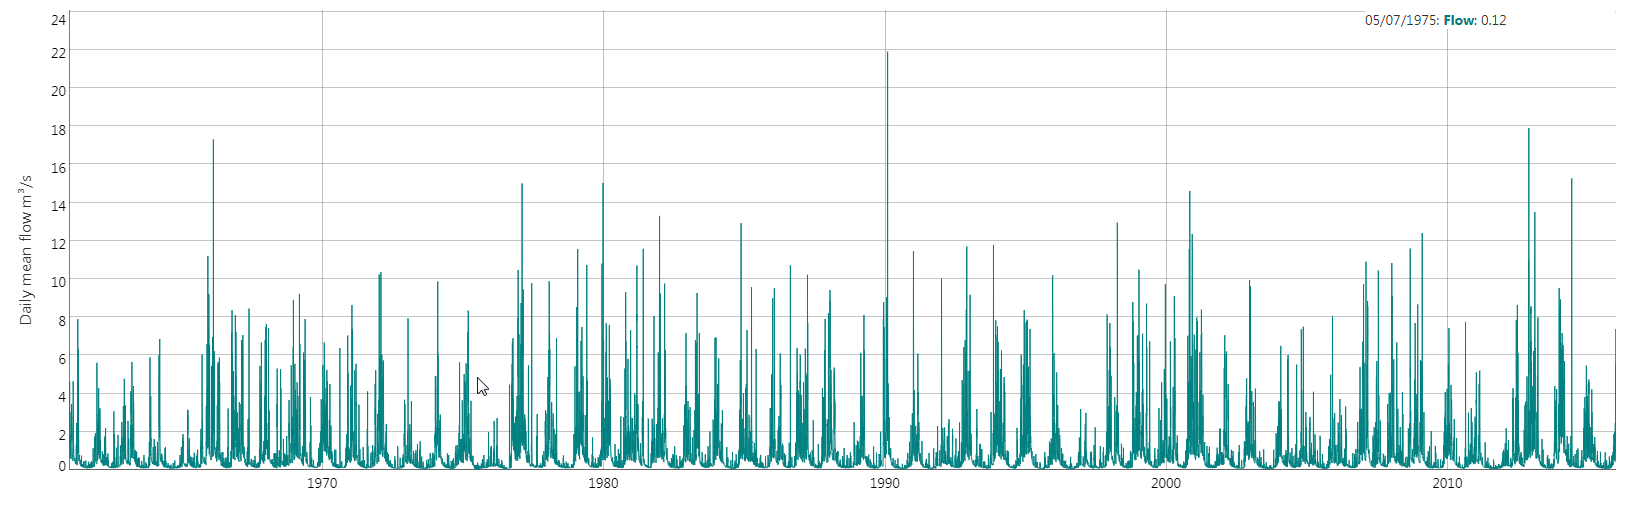
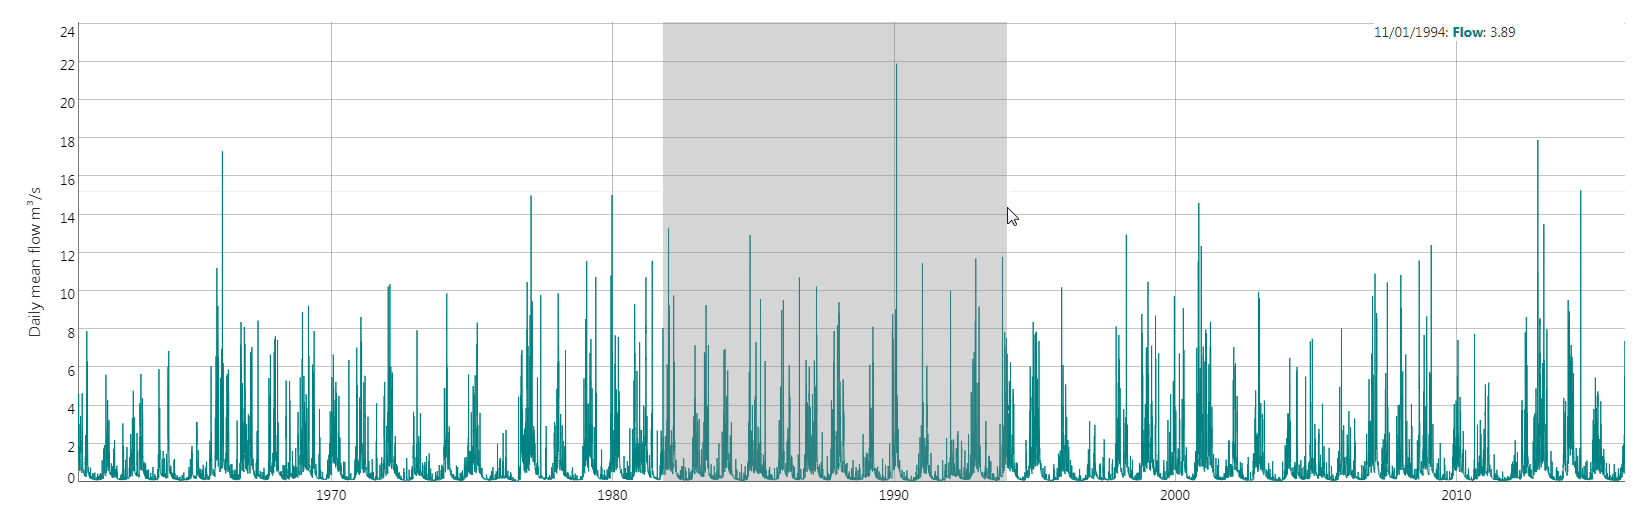
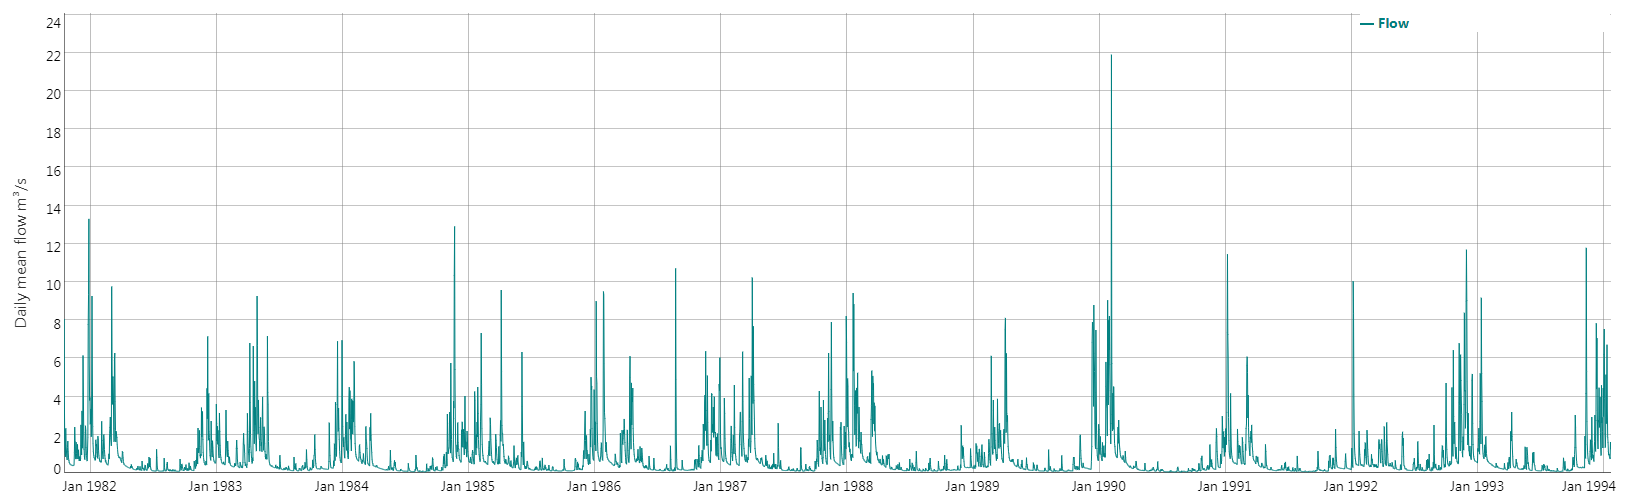
Click, drag and release on the chart to zoom to a selected period. Double click on the chart to return to the full period.
Considerations for a user-defined catchment
Catchment boundaries are used within the flow estimation relative to impoundment catchments and local data gauge catchments. Therefore a warning to check your catchment boundary is displayed if you model a user-defined catchment that contains a significant impoundment or if the estimate is using the Local Data Algorithm.
If the user-defined boundary is significantly different to an upstream impoundment catchment boundary or a local data gauge catchment boundary, you should consider disregarding the influenced flow statistics or unselecting 'use local data' under the advanced settings for this catchment.